SOS-Report Collection Script
On this page
Overview
The Network Operator SOS-report script collects comprehensive diagnostic data from a Kubernetes cluster running the NVIDIA Network Operator. It gathers all relevant configuration, logs, status information, and diagnostic output into a single archive, making it easier to troubleshoot issues and share context with support teams.
The script is fully backward compatible and is designed to work with any version of the Network Operator, including all previous releases. Components or resources that are not present in a given release are gracefully skipped without errors.
The script and full README are available on GitHub at scripts/sosreport.
Installation
As a kubectl Plugin (Recommended)
Copy kubectl-netop_sosreport, generate-report.py, and report-template.html to a directory in your PATH:
# Install system-wide
sudo cp kubectl-netop_sosreport generate-report.py report-template.html /usr/local/bin/

# Or install for the current user only
mkdir -p ~/.local/bin
cp kubectl-netop_sosreport generate-report.py report-template.html ~/.local/bin/
export PATH="$HOME/.local/bin:$PATH"
Once installed, the script is available as a kubectl subcommand:
kubectl netop-sosreport [OPTIONS]
Note
generate-report.py and report-template.html must be in the same directory as kubectl-netop_sosreport for HTML report generation.
If these files are not present locally, the script will attempt to download them from GitHub.
If download fails, the collection still works but the HTML report is skipped.
As a Standalone Script
Run the script directly from the repository:
./kubectl-netop_sosreport [OPTIONS]

# Or use the backward-compatible symlink
./network-operator-sosreport.sh [OPTIONS]
Requirements
kubectlbinary installed and inPATHValid kubeconfig with cluster access
Permissions to read cluster resources (
cluster-adminrecommended)Bash 4.0 or later
Python 3.6+ (for HTML report generation)
Standard Unix utilities (
tar,gzip,sha256sum)
Usage
Basic Usage
# Run with auto-detection (recommended)
./network-operator-sosreport.sh

# Specify kubeconfig explicitly
./network-operator-sosreport.sh --kubeconfig /path/to/kubeconfig

# Specify operator namespace
./network-operator-sosreport.sh --namespace nvidia-network-operator
The script automatically detects the Network Operator namespace and the cluster platform (Kubernetes or OpenShift).
Command-Line Options
Option |
Description |
|---|---|
|
Path to kubeconfig file. Default: |
|
Network Operator namespace. Default: auto-detect. |
|
Output directory. Default: |
|
Do not create a tarball; leave output as a directory. |
|
Number of log lines to collect per pod. Default: |
|
Skip running diagnostic commands in OFED pods ( |
|
Skip HTML report generation. |
|
Path to the |
|
Enable verbose output during collection. |
|
Show the help message. |
What’s Collected
Custom Resources
All custom resources managed by the Network Operator are collected, including their definitions and instances. For a full reference of available CRDs, see Customization Options and CRDs.
Operator Resources
Deployment, Pods, ConfigMaps
Secrets (metadata only, no secret data)
RBAC resources (ServiceAccounts, Roles, RoleBindings)
Events in the operator namespace
Webhook configurations (validating and mutating)
Components
The script collects data from all Network Operator components. Components that are not deployed in the cluster are automatically skipped. For the full list of components, see Network Operator Component Matrix.
For each component, the script collects:
DaemonSet or Deployment specifications
All pod details and status
Current and previous container logs (if the container has restarted)
Related ConfigMaps and Services
Node Information
All node details with labels and annotations
Node conditions and status
Allocatable resources (RDMA, SR-IOV, GPU)
Node-specific feature discovery labels
Diagnostic Commands
The following commands are executed inside OFED driver pods on each node:
lsmod | grep mlx— loaded Mellanox kernel modulesibstat— InfiniBand device statusibv_devinfo— RDMA device informationmst status— Mellanox Software Tools statusuname -r— kernel versiondmesg(last 200 lines) — recent kernel messagesip link/ip addr— network interface information
Note
Use --skip-diagnostics to skip these commands for faster collection when driver-level diagnostics are not needed.
HTML Report
The collection script automatically generates a self-contained HTML report (report.html) that provides an interactive, navigable view of all collected data.
The report is included in the output archive alongside the raw files.
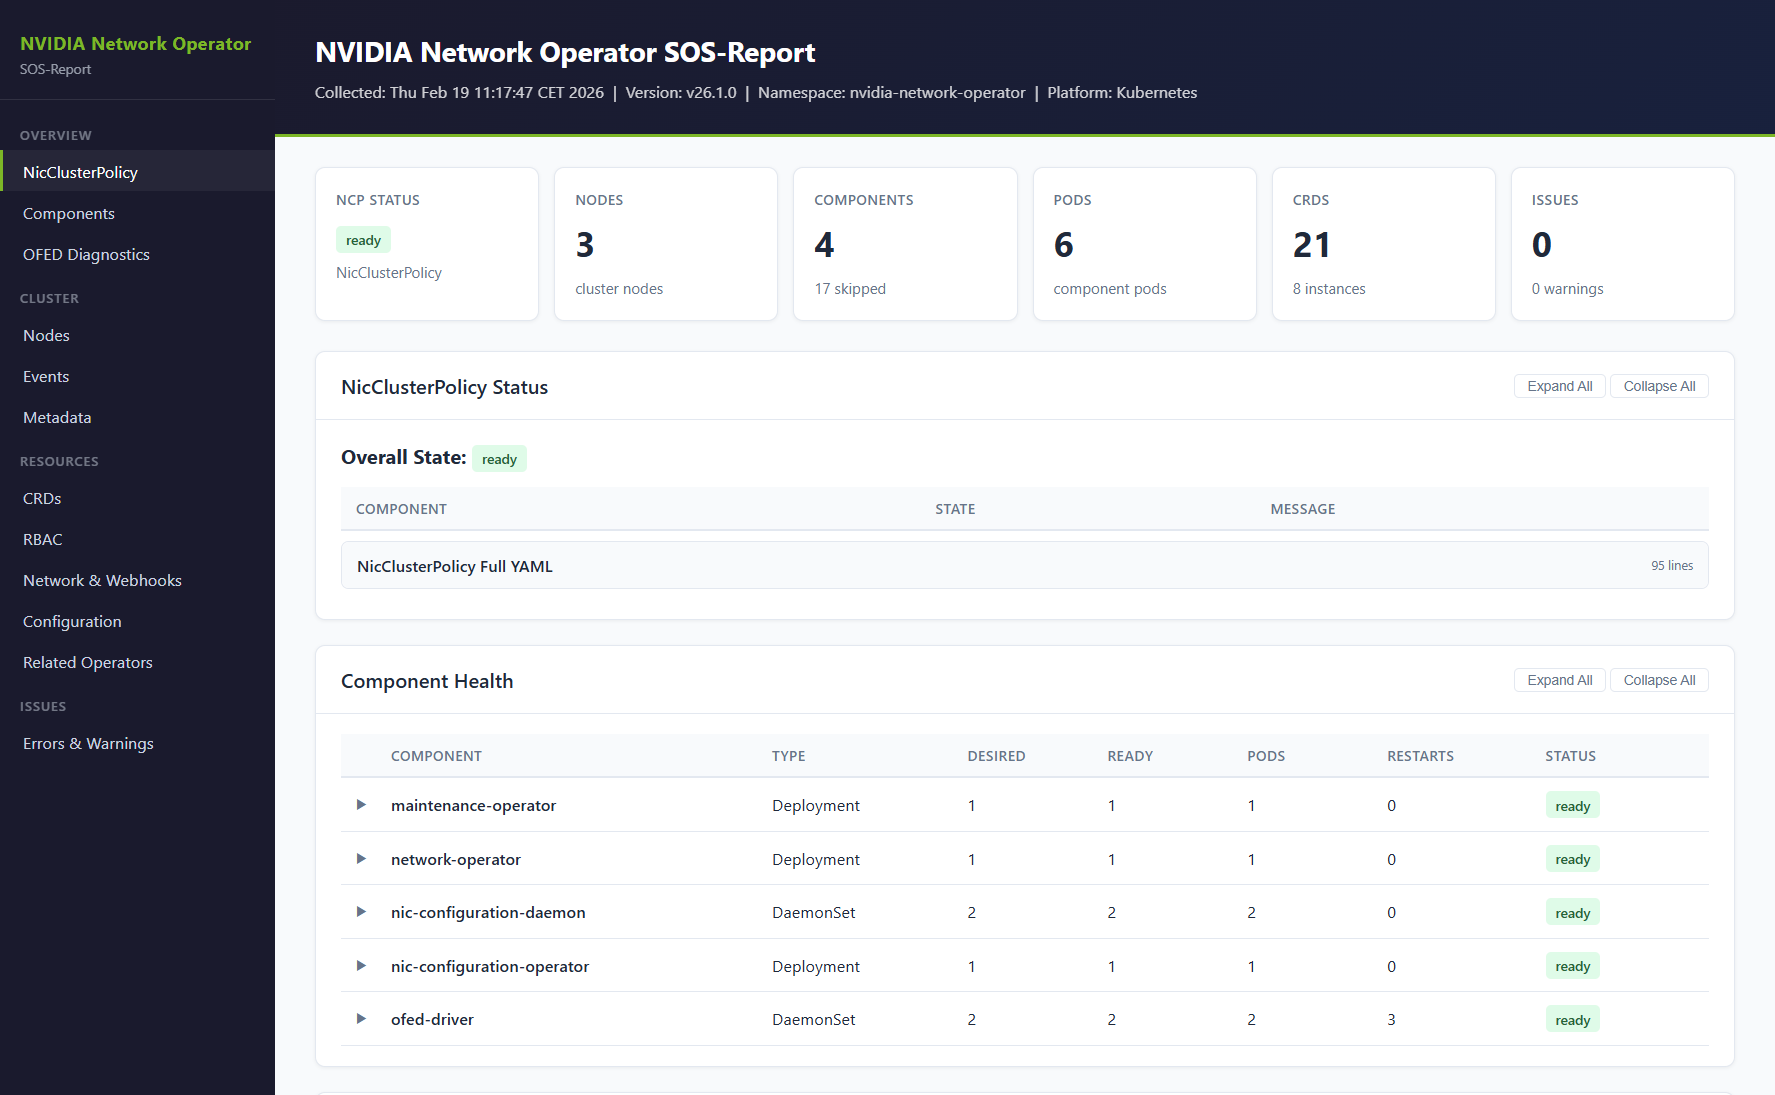
The report includes the following sections:
Executive dashboard with overall NicClusterPolicy status, node count, pod health, and error summary
NicClusterPolicy applied states with color-coded status badges
Component health grid showing all components with desired/ready replicas, pod counts, and restart counts
Per-component detail panels with workload YAML, pod status, and log viewers with error/warning highlighting
OFED diagnostics per node
Node overview with summary table, resource allocation, and labels
Events timeline with warning highlighting
CRD inventory with definitions and instances
RBAC overview, network configuration, and webhook configuration
Collection errors and warnings
The report can also be generated standalone from an existing sosreport directory:
python3 generate-report.py ./network-operator-sosreport-20260218-143000/ --template report-template.html

# Custom output path
python3 generate-report.py ./network-operator-sosreport-20260218-143000/ --template report-template.html --output /tmp/report.html
To skip report generation during collection, use the --skip-report flag.
Output Structure
The script creates a timestamped directory with the following structure:
network-operator-sosreport-<timestamp>/
├── metadata/
│   ├── collection-info.txt
│   ├── cluster-version.yaml
│   ├── namespaces.txt
│   └── api-resources.txt
├── crds/
│   ├── definitions/
│   └── instances/
├── operator/
│   ├── namespace.yaml
│   ├── configmaps.yaml
│   ├── secrets-metadata.txt
│   ├── rbac/
│   ├── events.yaml
│   ├── validatingwebhookconfigurations.yaml
│   ├── mutatingwebhookconfigurations.yaml
│   └── components/
│       ├── network-operator/
│       ├── ofed-driver/
│       │   ├── daemonset.yaml
│       │   ├── pods/
│       │   └── diagnostics/
│       └── ...
├── nodes/
│   ├── all-nodes.yaml
│   ├── nodes-summary.txt
│   ├── node-labels.txt
│   └── node-resources.txt
├── network/
│   └── services.yaml
├── related-operators/
├── diagnostic-summary.txt
├── report.html
└── collection-errors.log
By default, the output is compressed into a tarball with a SHA256 checksum:
network-operator-sosreport-<timestamp>.tar.gznetwork-operator-sosreport-<timestamp>.tar.gz.sha256
Exit Codes
Code |
Meaning |
|---|---|
|
Success — all data collected. |
|
Critical error — |
|
Partial success — some resources failed to collect. |
Security Considerations
Secrets: only metadata (names and types) is collected. Secret data is never included.
Logs: may contain IP addresses, hostnames, and other environment-specific information.
Review: always review the collected data before sharing it externally.
Example Workflows
Troubleshooting Pod Failures
# Collect full diagnostics with verbose output
./network-operator-sosreport.sh --verbose

# Extract and check the diagnostic summary
tar -xzf network-operator-sosreport-*.tar.gz
cat network-operator-sosreport-*/diagnostic-summary.txt

# Look at specific component logs
cat network-operator-sosreport-*/operator/components/ofed-driver/pods/*.log
Quick Health Check
# Fast collection without driver diagnostics
./network-operator-sosreport.sh --skip-diagnostics --log-lines 1000

# Extract and check summary
tar -xzf network-operator-sosreport-*.tar.gz
less network-operator-sosreport-*/diagnostic-summary.txt
Preparing for a Support Case
# Comprehensive collection with verbose output
./network-operator-sosreport.sh --verbose --log-lines 10000

# Verify the archive integrity
sha256sum -c network-operator-sosreport-*.tar.gz.sha256

# The archive is ready to attach to a support case